I have created scatter plot with straight line with markers in Excel and I wish to annotate them with a set of numbers, which is my sample number.
I have 4 Y values with same X values, and wish to annotate them with sample number.
However, when I apply such function, only one of them got applied with the sample number 1-12.
The other 3 sets of data got labeled with sample number 12 only.
Would it be possible for me to structure all of them with sample number 1-12?
Thanks.
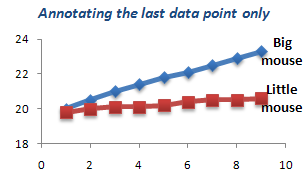
If I get you right, you want something like this?
To accomplish this, choose “Read labels from these cells…” in the “Annotate” dialog, and check “Apply to last data point only.”
Cf. xltoolbox.sourceforge.net/annotate
Please let me know if this does not solve your problem.
Daniel
There are 4 series of lines and each lines consists 12 data points.
And I want to annotate each data point in the line.
So it should appear 1-12 for 12 data points for all the 4 series.
What happened now was only 1 series was in this order and another series is appearing ‘12’ for all data points.
Got it. This was a bug. I quickly fixed it, you can download the new version 6.53 right now to make it work.
Daniel
Thanks a lot.
This problem is resolved.
However, similar problem arise.
I have 2 sets of data which I like to plot.
1 set has 11 data points and 1 has 1 data point.
For the 2 sets, basically I wanna split and compare the outlier and show the difference.
But, I could not annotate it properly.
For the 1st set, only 1st data point was annotated and the 2nd set is annotated too but with a wrong one (but I didn’t actually ask it too annotate 2nd set).
Could you please kindly have a look at it?
Thanks.
To get this to work, you would need to put the annotation in a comment, rather than a dedicated cell: Right click on a cell and choose “add comment”.
If you request the Toolbox to read the annotations from a dedicated range of cells, it will indeed apply all of these annotations to every series in the plot. This could be solved by checking if the annotation cells are just one row or one column, or several rows/columns, and reading the comments from the appropriate row/column that corresponds to a series. One would also want a checkbox to indicate whether the annotations should be repeated if there are less rows/columns with annotations than there are series in the plot. However, I guess I will only implement this in the rewritten Toolbox (version 7.x) that I am currently working on.
Please let me know if putting the annotations in the cell comments is feasible for you.
Thanks. it works quite ok…
