Attempt to detect embedded labels makes use of Excel’s ability
to embed text boxes into charts. To embed a text box into a chart,
select the chart first, then insert the text box in the usual way.
When you subsequently move the chart, you will notice that the
text box moves with it. This happens because by selecting the
chart before inserting the text box, you embedded the text box
in the chart. To have the Toolbox use the text found in embedded
text boxes as figure labels for the file name, make sure that you
have a consistent way of labeling your charts with embedded text
boxes. Thus, you could write Figure 1 or A).
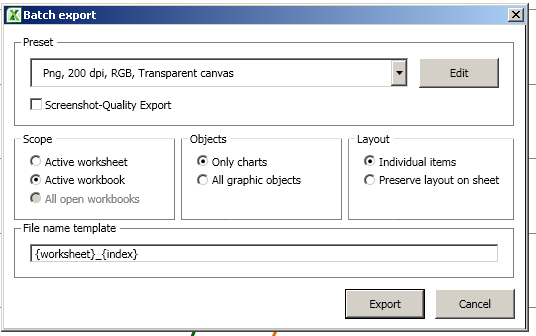
Hello. I have just installed XLToolbox; I found it searching for a tool to batch export all charts. This one seems to have what I need; however, its interface looks different than what is shown in your site - it has one single window with only several options, please see attached file.
Can you, please, tell me why don’t I see the same rich interface as shown here on your site?
those screenshots on the website are very old, I just never had time to update them. The new interface looks simpler, but does provide the same feature set. One important difference is that you can define presets with graphic formats (in your example “PNG, 200 dpi, RGB, Transparent canvas”). Just click on “Edit” in the top-right corner to change those settings.
Hello, Daniel; thank you for your prompt reply and explanations! Yes, I found my way through this interface easily, it is intuitive; but still that previous interface seems to have more options than this simple interface.
At least, it’s missing one crucial option that I’m interested in: selecting export folder with “Workbook folder” option - I guess that option exports charts to folder where the workbook itself is located, and it would be very useful, rather than selecting folder manually. Is there that option in this new version, and I overlooked it?