Both Microsoft and Google (and probably others) have a flawed method of calculating standard deviations. They hit the limits of the calculation engine with large numbers. They have no interest in fixing the flaw - perhaps so you always get the same perhaps wrong answer with different versions of Excel.
Try SD of 1,2,3 = 1
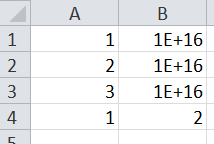
But add 1E+16 to each number and you get zero. Add a number between 1E+15 and 1E+16 and you get a range of numbers for the SD.
Taking the mean of the series from each number before calculating the SD seems to solve the problem
May be a vaguely useful function for the toolbox.
David,
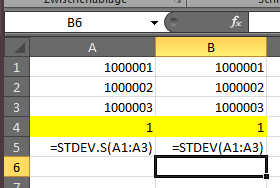
on Excel 2010 and Excel 2016 I get the expected results:
Excel 2016:
Excel 2010:
Which Excel version produces incorrect results?
Hi Daniel
1E+16 - not 1E+6
You would rarely get this situation in practice, but anyone using Excel
seriously should be aware of the limitations
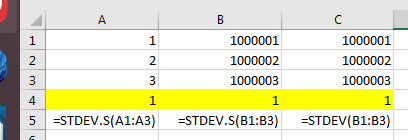
Below (Excel 2016, but version matters little):
Col A: 1,2,3 and the expected SD 1
Col B: Result when 1E+16 is added to each number
Its really about the machine epsilon
I was forced to learn a bit about Excel when I was doing some numerical
modelling and ended up with some 400 spreadsheets. I produced (spaghettli
code) to loop through the work sheets and produce an Index worksheet. I
used Ctl Shift G in a blank square to return to the Index sheet and then
the same keystrokes in that sheet to go to a particular sheet, Cell A1 in
each sheet was reserved for a comment which was listed in the index, along
with the Y axis for graphs.
Another macro I still find useful saved Charts as PNG files in the same
directory as the spreadsheet, using the name of the chart tag as the
filename. When I was running my numerical models, the model parameters were
inserted in the chart tag and made a unique file name. Simple code, but
saved me a lot of time.
Another function I used sometimes was for calculating the geometric mean of
a series when some of the numbers were zero or negatived. This occurs when
the numbers produced by an instrument sometimes go negative. I’d replace
the zeros/ small negative numbers during the GM calculation with a small
number/ detection limit.
Feel free to use the ideas
Cheers
David
Oh, I see.
As for a UDF (user-defined function), I’d be a bit hesitant to add (another) one. UDFs tend not to work very well when a workbook is opened on a different computer. I used to have a =panova function in the older versions that computed the p value for an analysis of variance.
There’s the screenshot command right now to quickly export charts to PNG files. It’d be fairly easy to construct a default file name based on the chart name.
Thanks for your suggestions!